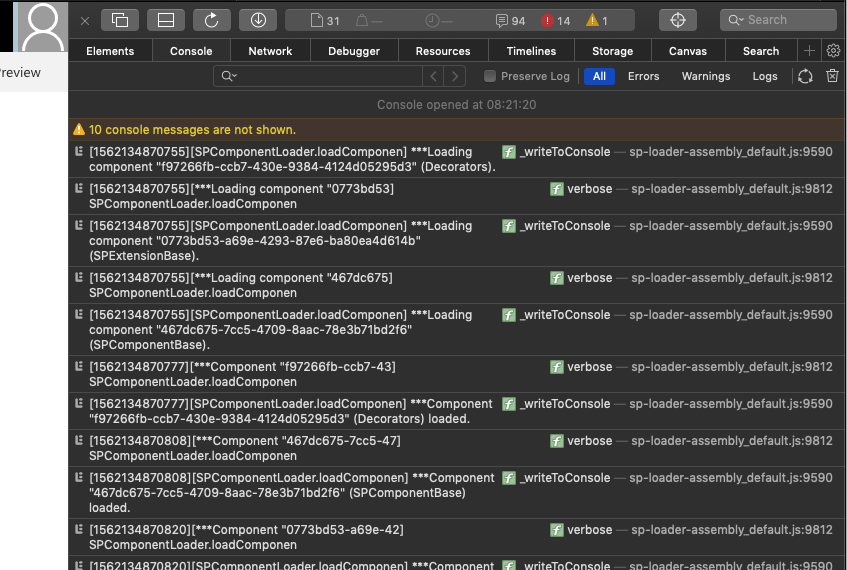
If you try to log something in your SPFx project, it can be tough to find your ‘console.log’ messages. SharePoint Framework, in that sense, is chatty.

Chatty SPFx console in SPFx projects
If you try to log something in your SPFx project, it can be tough to find your ‘console.log’ messages. SharePoint Framework, in that sense, is chatty.

Chatty SPFx console in SPFx projects
When you are working with SPFX and you start it with gulp serve, it takes some time to start. During this startup many things happen but there are not clear indication if SPFx is working or what it actually does.

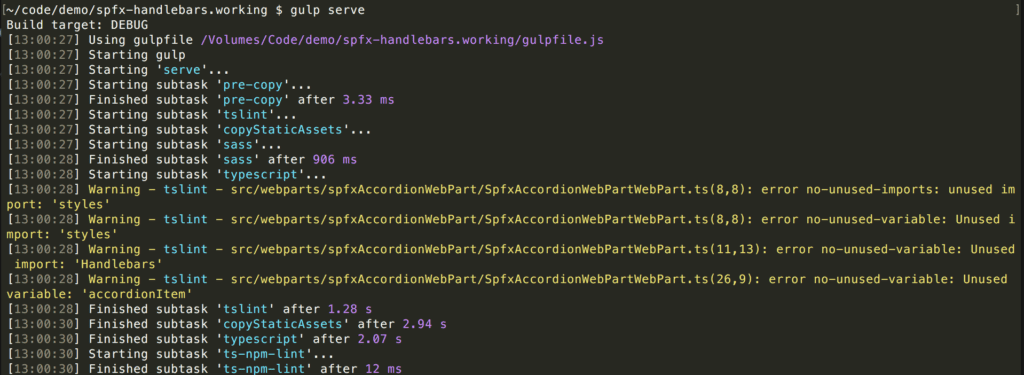
gulp server – default start
Once the workbench was started you see all the gulp task that will be executed with or without error and what it actually does.
The background tasks are well hidden, but you can take a peek into those background activities. It’s just a simple trick, but I use it every time now when I work with SPFX now.
Instead, execute gulp server and add the command line option --verbose. Execute SPFx with:
gulp serve --verbose
Now the hidden world and architecture of SPFX will become more visible. In additon you get sometimes many additonal informations what might goes wrong.

gulp serv – with verbose logging
From my point of view, it is easier and helps with debugging.
I will also see if the issue is caused by your configuration, code or locate a problem with SPFX.
Happy coding!!!
Recently I updated the Internet Explorer on one of my SharePoint Development Servers to IE 10. Since then I wasn’t able to script debug directly in Visual Studio 2010. The problem was whenever I tried to attach to the Internet Explorer process I got the error message that a debugger is already attached to this process.
The reason for this problem can be found in the wrong registered “msdbg2.dll” of IE 10. What needs to be done is to re-register the dll in 32-bit mode.
First start the cmd.exe in 32-bit mode. For this you need to run “C:\Windows\SysWOW64\cmd.exe”
In the command line execute the following command to re-register the dll.
regsvr32 “%ProgramFiles%\Internet Explorer\msdbg2.dll”
Once this is done restart your Visual Studio 2010 and now the debugger should be able to connect again to the Internet Explorer process.
The solution for this I found with some luck at Microsoft Connect and worked well for me.