If you try to log something in your SPFx project, it can be tough to find your ‘console.log’ messages. SharePoint Framework, in that sense, is chatty.
Chatty SPFx console in SPFx projects
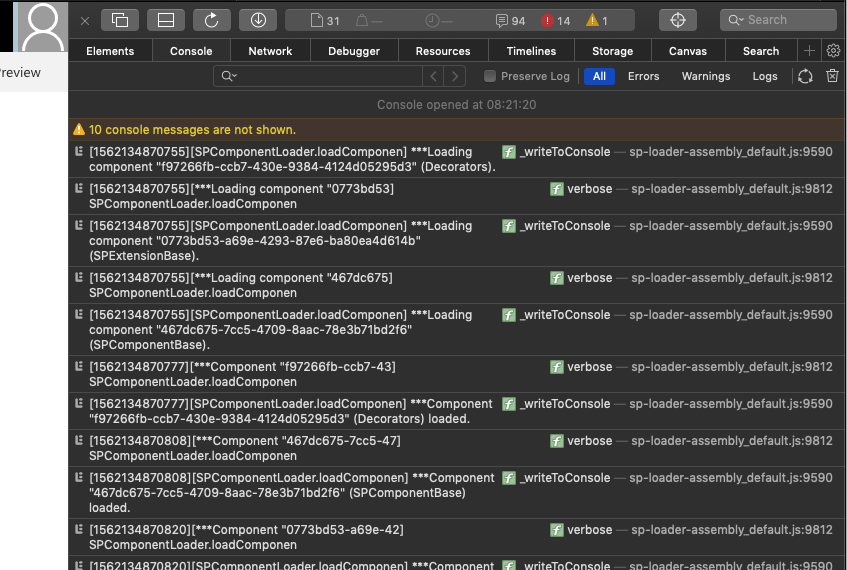
So even with the default hello world web part you get at least in my case.
- 1 Error
- 4 Warnings
- 104 Log entries
- 2 Infos
Overall you get 111 log entries, and most of them are probably irrelevant for your web part. The good thing here is that a modern browser allows you to filter these categories.
For example, in Firefox:
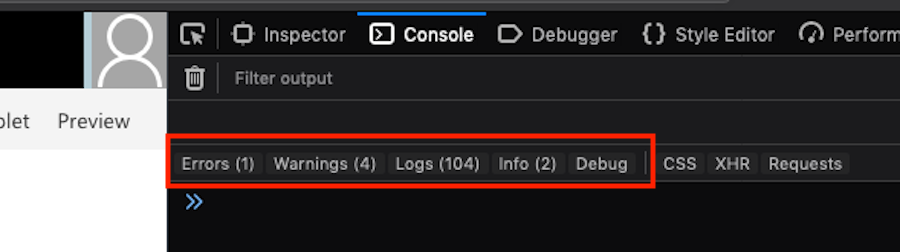
Firefox console log filtering
Chrome:
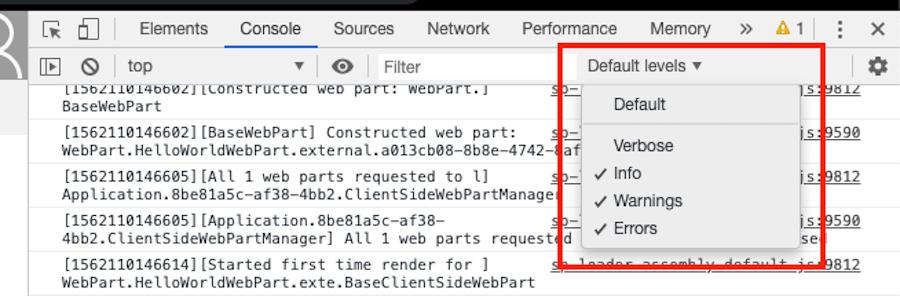
Chrome console log filtering
moreover, last but not least, Microsoft Edge:
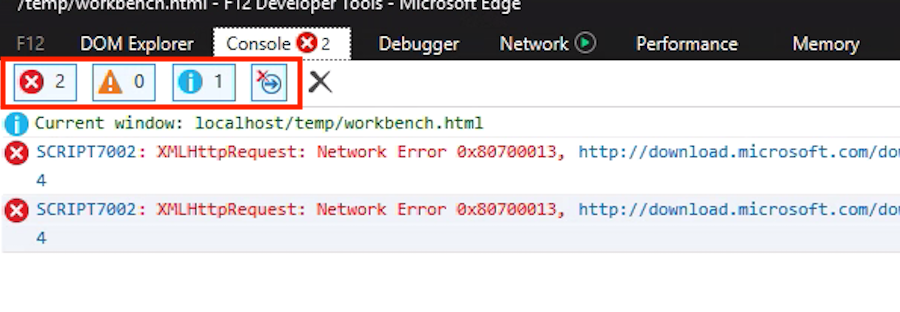
Microsoft Edge console log filtering
The only question is, how get these different categories written to the console?
The console.log the right thing to use?
What console.log does is to output log information. While developing a new web part or web application what you want to do is to output a debug information and not a log entry.
console.debug('My Debug Entry');
Instead of using console.log for modern browser it is better to use console.debug instead.
Firefox is my preferred development browser at the moment in the information gets directly written to the debug section.
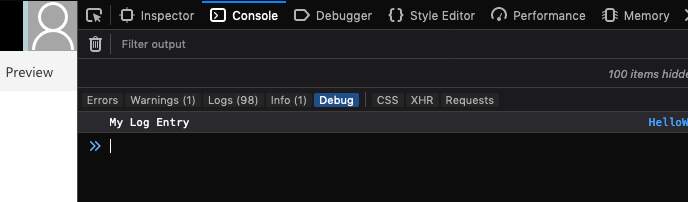
Firefox only filtered for debug
So I can filter out all other less relevant information. The same works in Chrome too, but the right filter option is Verbose only.
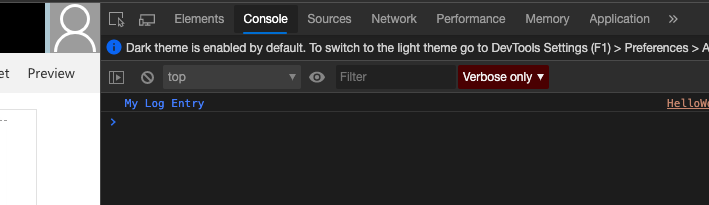
Chrome filtered only for debug information
The only browser that fails this test is Edge. The entry there still gets logged, but there is no way to filter for debug information apart from regular log entries.
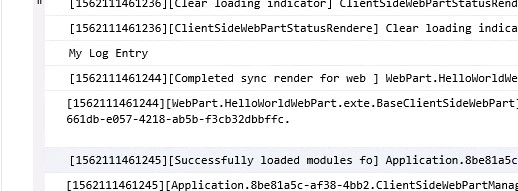
Microsoft Edge is not capable of filtering
Honestly, do we care, while debugging or developing? 😉
But there is more
‘console.debug’ is just on the way to be more explicit on outputting the debug information. I highly recommend what else you can do with the ‘console’ object of your browser. Check out all the possibilities that the console object gives you on the MDN page on the console object.
At least console.debug is supported since Internet Explorer 10.